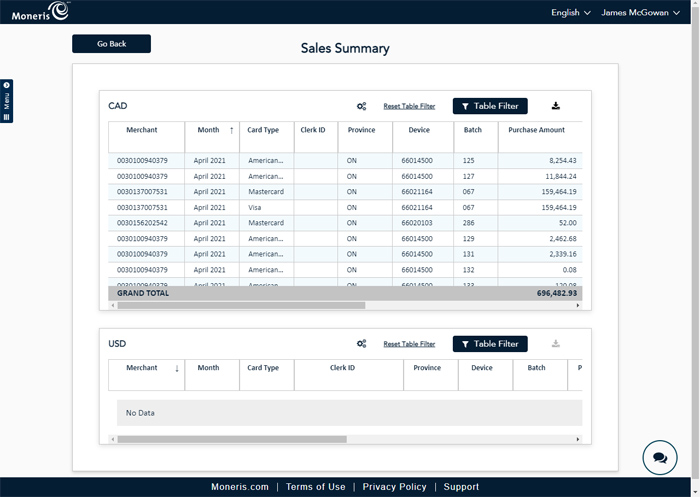
The Sales Summary report enables you to generate and view various sales summary data on settled transactions by card type, clerk ID, province, device, or batch number. The data is presented as gross or net sales by merchant, chain, or superchain, if applicable. Data on the report can be grouped by day, month, or for a custom date range. This report lists funds processed in Canadian (CAD) and American (USD) currencies.

Use this report to see the following:
gross and net sales for a date range for selected accounts.
number of purchases and refunds processed for a date range for selected accounts.
dollar amount of purchases and refunds processed for a date range for selected accounts.
The report is able to be run for a date range of 31 days at a time.
When selecting accounts (Superchain, Chain, or Merchant), the Sum by all selected accounts flag enables you to see a sum total of transactions and dollars for each card type for the selected accounts. Leaving it unchecked provides the ability to see the data in a more granular level.
Note that when the Sum by all selected accounts box is checked:
the “Card Type” filter is automatically selected and disabled. All other optional filters are disabled with this new filter.
the new views will be generated on the screen, however, the option to move, sort, or hide columns will not be available in this view.
the downloaded report will reflect the new totals generated on the screen in this view.
Note: You can choose to de-select this filter. When the Sum by all selected accounts box is left unchecked, the “Card Type” filer will be active again and merchants can generate all the other views.
Grouping options
Grouping options are available at the bottom of the screen in the Group By section. The data can be grouped by:
The checkboxes under the Optional heading enable additional columns to be visible in the data table. Leaving them unchecked means the column won't appear on the report output.
Note: PetroTrak appears as an additional card type on the Sales Summary by Card Type report.
Note: The Batch checkbox is dependent on the Device checkbox; if it is not checked, the Batch checkbox is greyed out.
The Date, Month, or Entire Date Range grouping options will determine how many entries you see. The more options that are selected, the more data will be displayed on the results. The Daily, Monthly, or Entire Date Range views present summaries of sales for the selected grouping.
Note: The screenshot below shows the Sales Summary with the Sum by all selected accounts checkbox checked.

How to run the report
Note: If you checked the Sum by all selected accounts checkbox, the option to filter, sort, and/or move columns is disabled. The screenshot below is the Sales Summary report with the Sum by all selected accounts checkbox left unchecked.

The report is able to be run for a date range of 366 days, up to two years in the past.
Refer to the descriptions of all of the sections that are available for this report.
Note: Field names are listed alphabetically on this page only to assist you with quick lookup and identification.