The dashboard
The dashboard provides a quick summary of sales and transaction data, presented using both numbers and graphs. To access the dashboard, click Dashboard on the main menu.
In this topic:
Select a date range
You can choose the date range of the data presented on the dashboard. There are many preset options: today, yesterday, this week, last week, this month, last month, this quarter, and last quarter. You can also select a custom date range using the date picker.
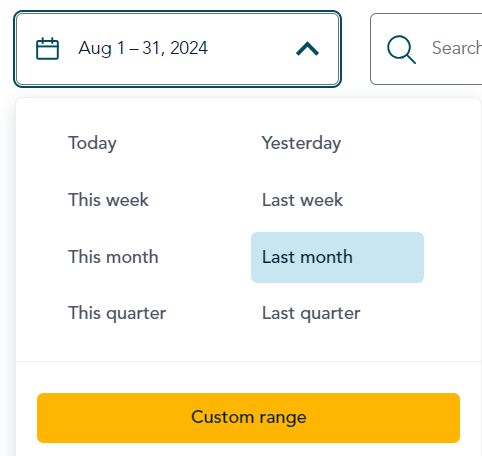 |
- Click on the date range button to view the options.
- Select one of the preset date ranges such as This week or This month. Or, click Custom range and go to the next step.
|
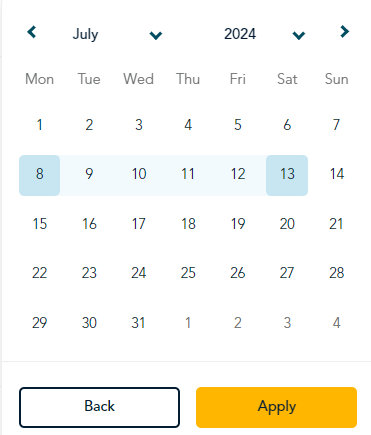 |
- When the date range picker appears, choose one or more of these options, as needed:
- Click the month to select another month from the dropdown list.
- Click the year to select another year.
- After selecting the month and year, click the first date and the last date in your custom date range. The dates in between are automatically selected.
- Choose one of these options:
- To apply the custom date range, click Apply.
- To return to the list of preset date ranges, click Back.
- To exit from the date picker without making any changes, click anywhere outside the date picker.
- If you selected a preset or custom date range, the data on the dashboard changes immediately the reflect the new date range.
|
Transactions data
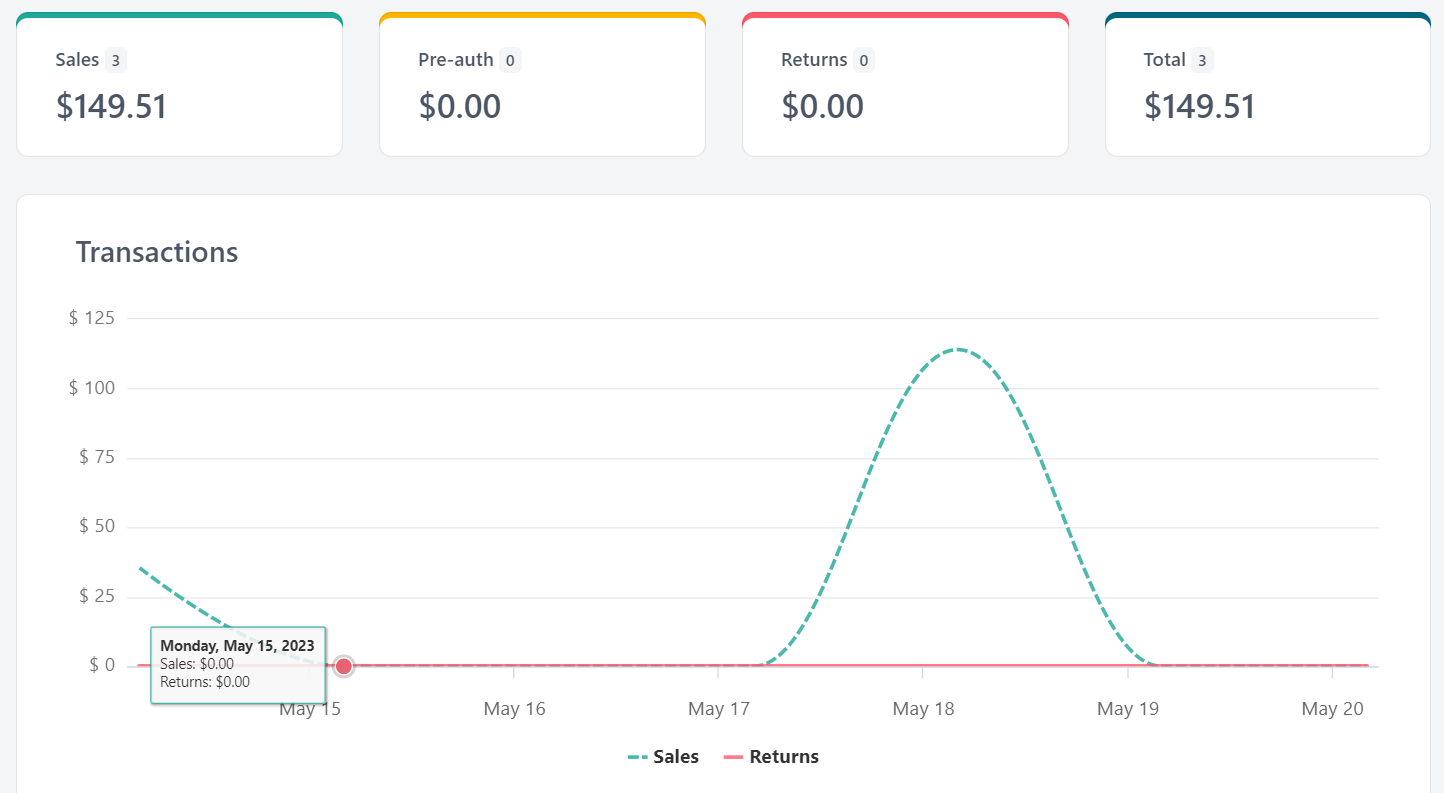
For the date range selected, the dashboard shows dollar values for transactions like sales (purchases) and returns. Those values are also presented as a graph. Hover your mouse on any data point on the graph to see a summary for that day.
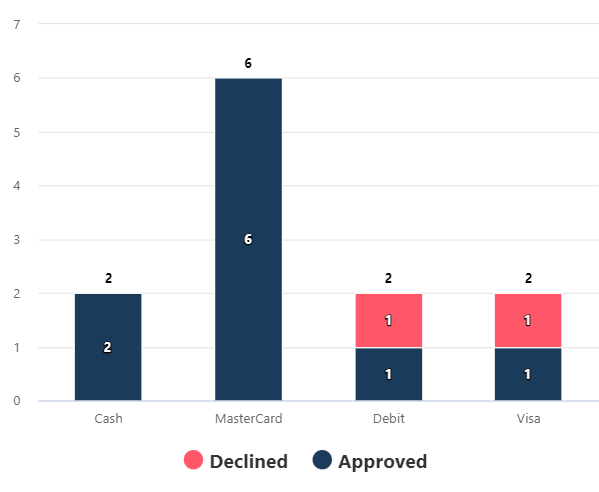
Approval by payment type
This chart shows the number of approved and declined transactions by payment type (cash, debit card, and credit card brands). Hover your mouse over any column to see a summary.
Transactions by payment type
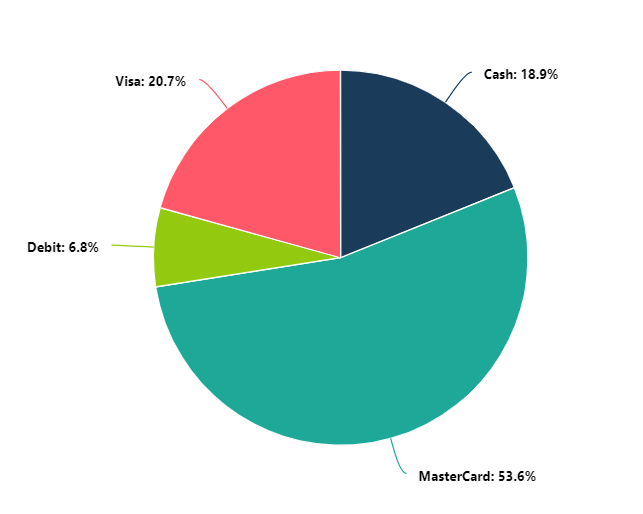
This pie chart shows your transactions by payment type: cash, debit card, and specific credit card brand. Hover your mouse any section of the pie chart to see a summary.
