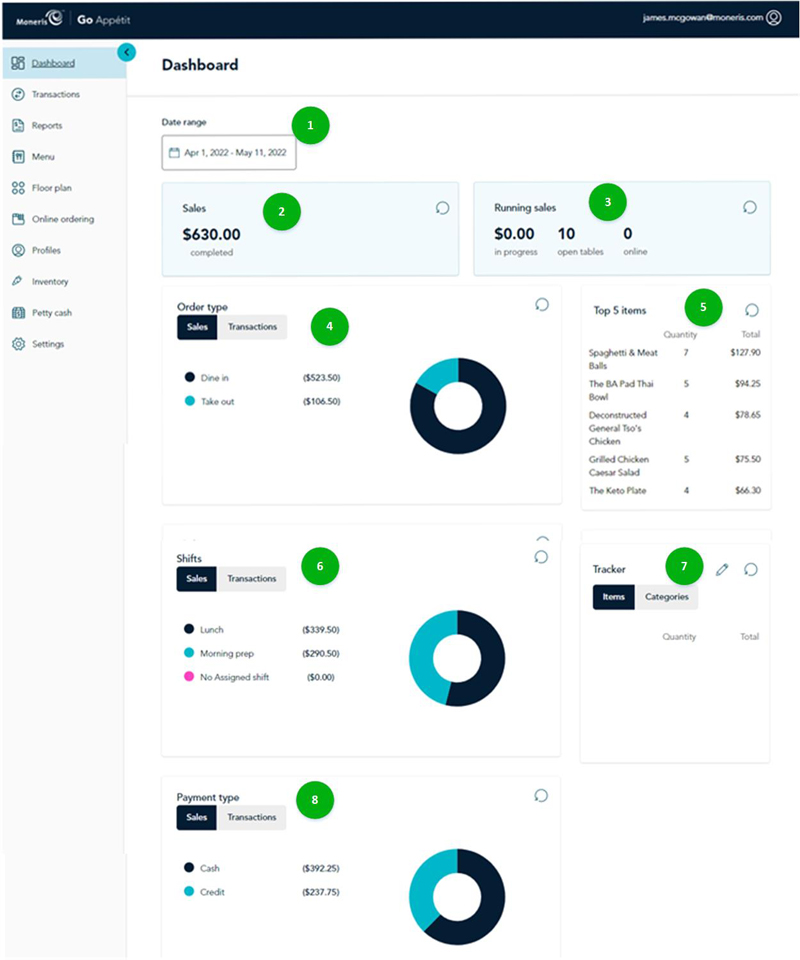
By default, when you logon to the portal, the Dashboard is the first screen visible to you. This dashboard presents a summary of sales information. Refer to the table below to understand the information presented in the screen.
| Number | Description |
| 1 | Date selector - Similar to the date selector in the reports, this tool enables you to select custom or preset date ranges to view dashboard data. |
| 2 | Sales - This section displays a sales total (combined across all channels) before taxes and after discounts within the selected date range. |
| 3 | Running sales - This section displays a summary of today's key metrics, including up to the minute sales amount, number of open tables, and the number of online orders placed as of the moment the dashboard is viewed. |
| 4 | Order type - This section displays net sales amounts and number of transactions broken down by the order channel for the date range. |
| 5 | Top 5 items - This section displays net sales amounts and quantities sold within the date range of your restaurant's top 5 sellers. |
| 6 | Shifts - This section displays net sales amounts and number of transactions broken down by shift for the date range. |
| 7 | Tracker - This section can be customized by you to display quantity sold and net sales amounts for the date range. You can select menu categories or individual items to display. Click the pencil icon ( ) and use the Tracker settings side panel to check the items you wish to track. ) and use the Tracker settings side panel to check the items you wish to track. |
| 8 | Payment type - This section displays gross sales amounts and number of transactions broken down by payment type collected. |