Daily sales
Click on the links in the table below to be taken to a description of the report.
| Sales reports | Inventory reports | Employee reports |
| Sales summary | Consolidated | End of day report |
| Daily sales | Consumption | User report |
| Item sales | Kitchens | |
| Alcohol sales | Vendors | |
| Modifier sales | ||
| Employee sales | ||
| Groups | ||
| Petty cash |
This section offers descriptions and use cases for the various reports available in the Moneris Go portal.
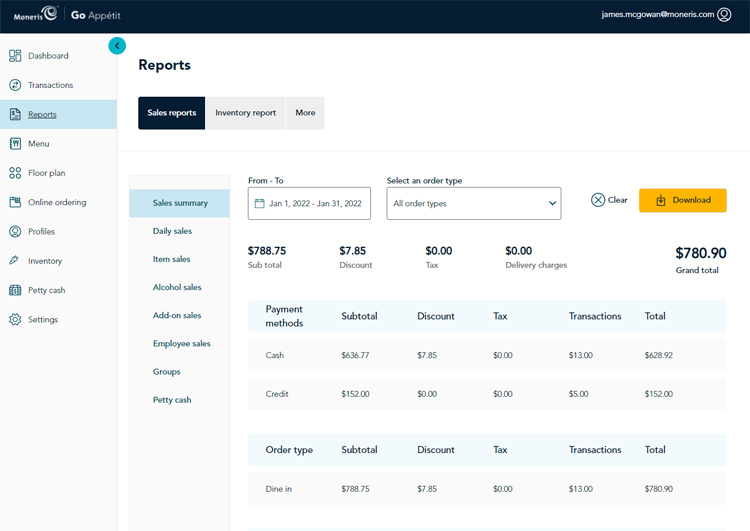
This report displays the amount from each payment method collected in your date range, the order types served within the date range, and the breakdown by shift when sales occurred. You can see the subtotal, discounts, tax, transaction amount, and totals.
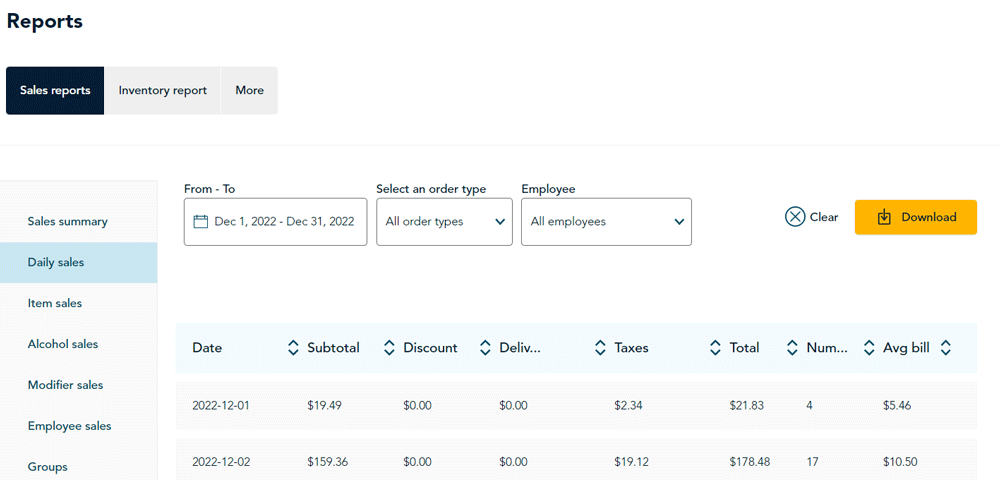
This report displays the sales amount for each day within the date range selected. It displays the date, subtotal of all sales, total discount amount, total amount collected from deliveries, taxes collected, total of all sales, number of transactions processed, and the average bill amount of all transactions for that particular date. You can filter the report by order type and by employee.
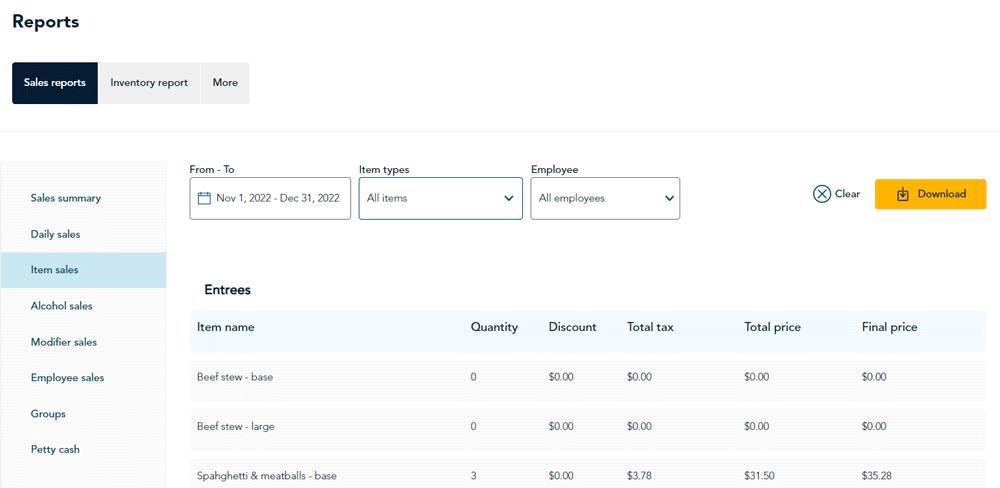
This report shows sales for menu items within the date range. The items are broken down by category on the report (i.e., you will see all the desserts grouped together, all entrées together, etc). You can see the item name, quantity sold, discount amounts, taxes collected, total price, and final price (after discounts have been subtracted). This report is handy to get a sense of what menu items are ordered in what quantities. You can filter the report by item type and by employee.
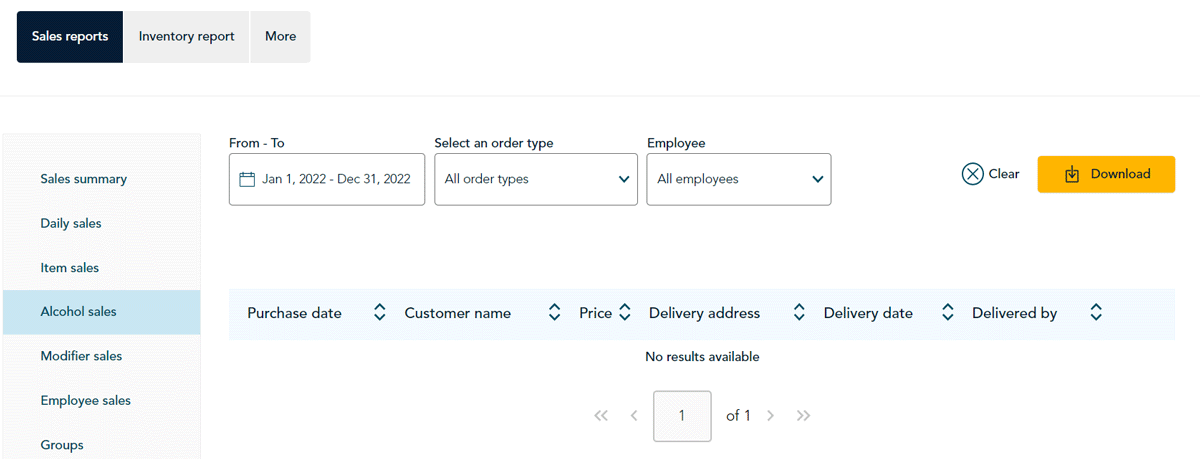
This report lists the alcohol sold and delivered within the date range. It lists the name and address of the customer who bought the alcohol, the price charged, the date it was delivered, and the driver who delivered the alcohol. You can filter the report by order type and employee.
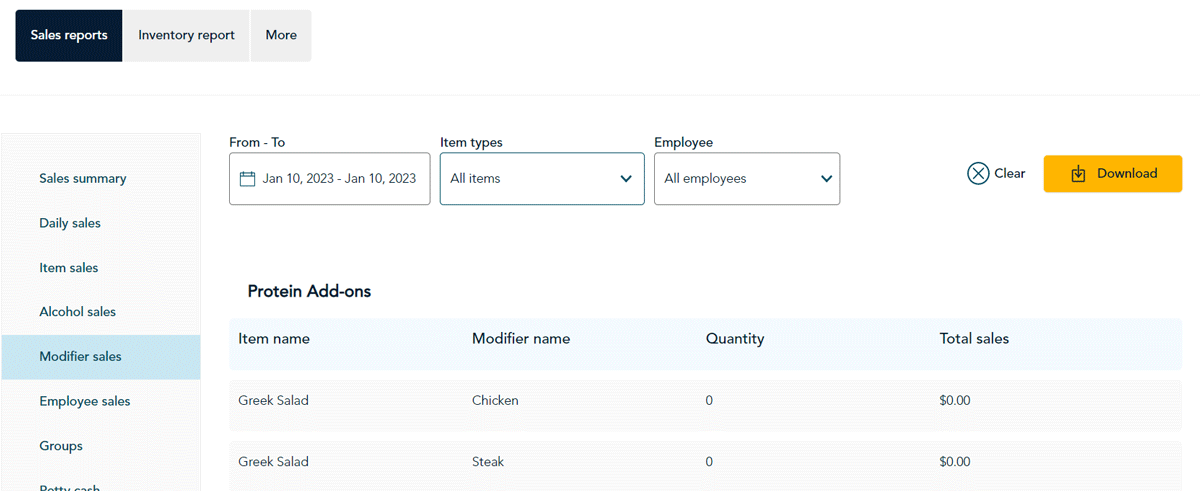
This report lists the modifiers (sides, toppings, etc) sold within the date range, the quantity sold, and the total sales amount. You can filter the report by item type and by employee.
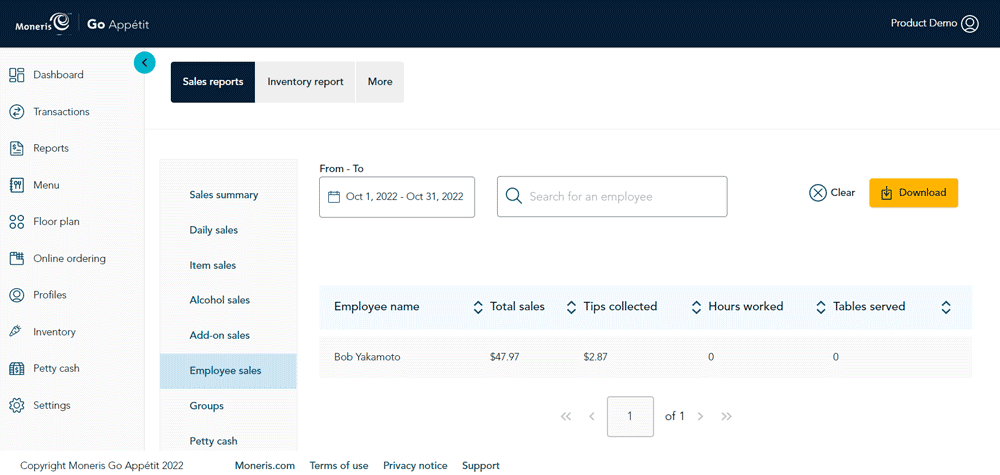
This report lists the employees credited with sales (by being signed in to the app and sending orders to the kitchen) within the date range. It shows their total net sales, tips collected, hours worked, and the number of tables they served.
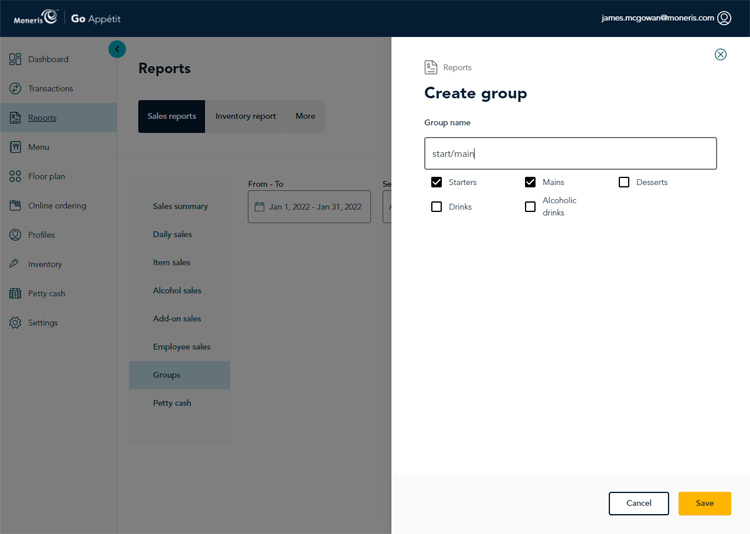
This report provides you the ability to customize the sales report output by allowing you to group together menu categories. For example, you may want to create a “Vegetarian” group if you want to see sales of all of your vegetarian menu options. Click the Create group button, and in the Create group side panel that appears, enter a name for the group and check the boxes for the menu categories that contain the items on which you wish to report.
Note: This report is by category only; it does not separate out individual menu items.
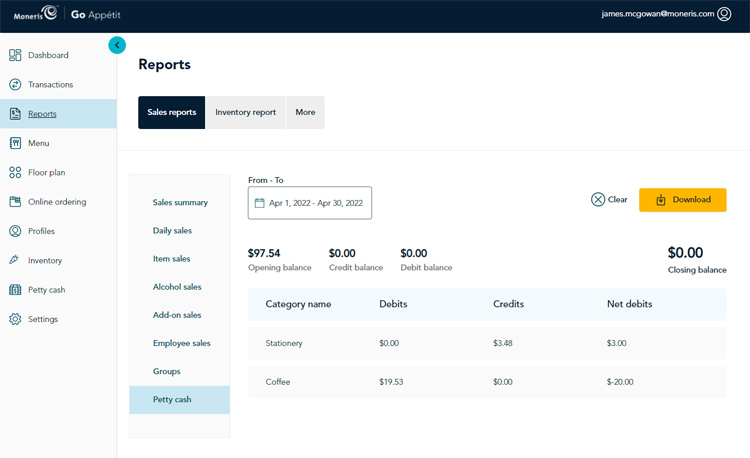
This report shows the petty cash transactions that have occurred over the date range, including the bill number, time and date, expense type, transaction type, any comments, the staff who reported it, and the total amount of the transaction.
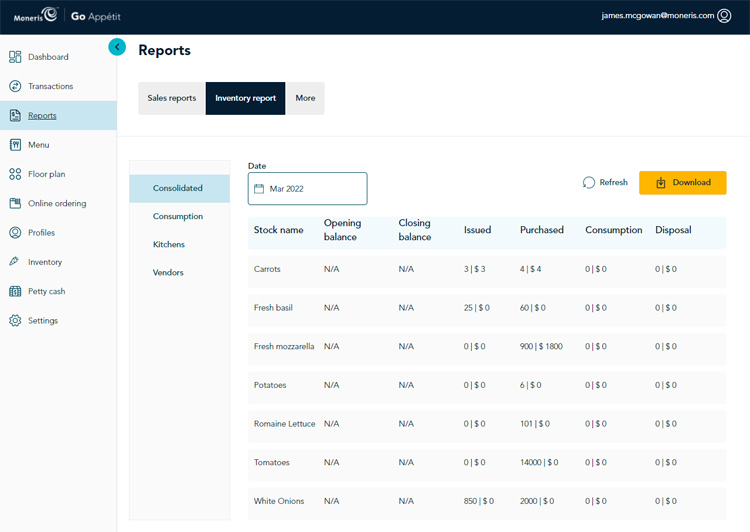
This report shows a summary of inventory item movement across the system, from items issued (send stock) to items returned (return stock issue), to items purchased through purchase orders, to items disposed of (the difference between issued, returned, and sold to guests). This report is run for one month at a time.
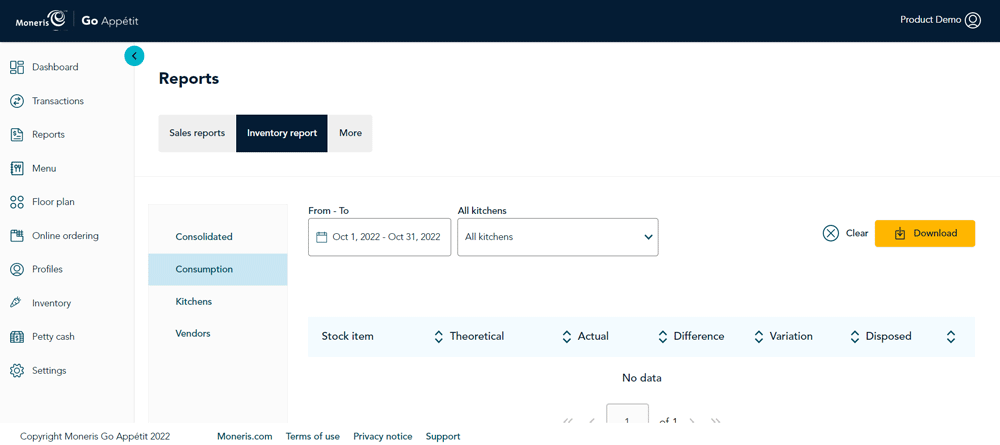
This report can be run for a date range, and shows the consumption data for stock items within that date range. It displays how much the system assumes will be consumed based on amounts used in recipes and sold within the date range against the actual consumption derived from doing send and return stock issues. For example, if 10kg of potatoes were issued to Kitchen 1 in the morning, and over the course of the day, 8kg of potatoes were consumed by sales, the theoretical balance should be 2kg returned. However, the report points out the actual amount consumed and the difference between the theoretical and actual.
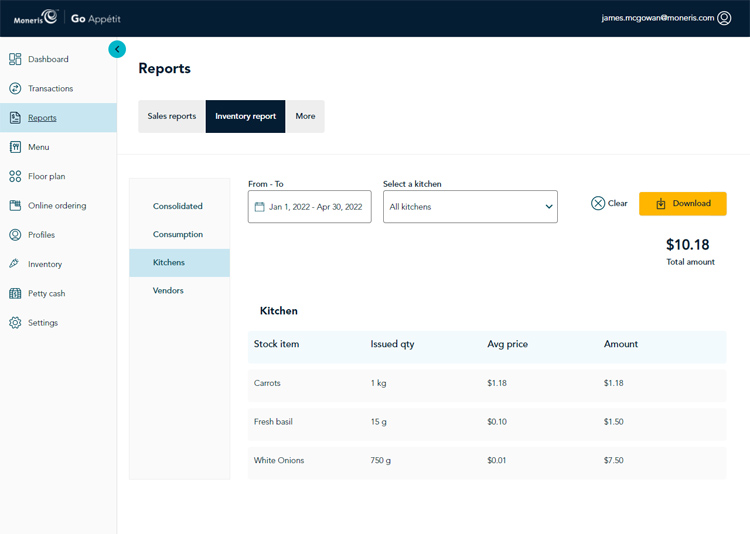
The Kitchens report can be run for a date range, and shows the issued quantity, average price, and total dollar amount of stock items issued to the various kitchens in your restaurant.
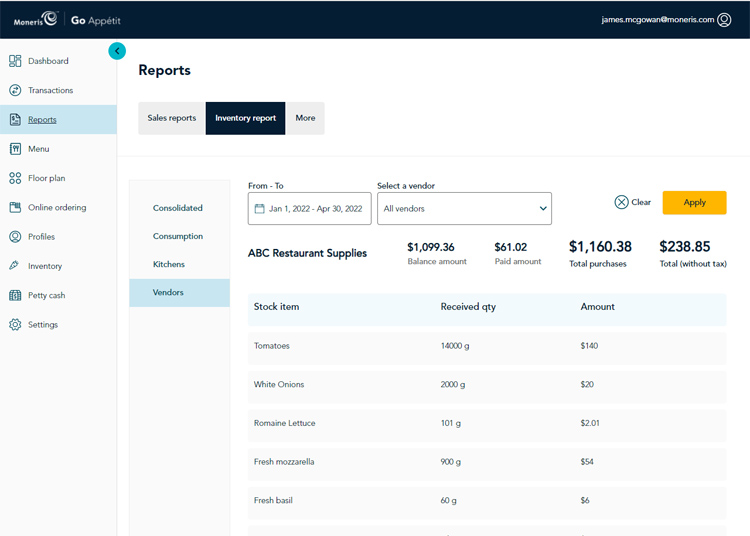
This report can be run for a date range. Select a vendor to see what stock items have been received in quantity and dollar amounts, as well as the amounts you have paid and outstanding balances.
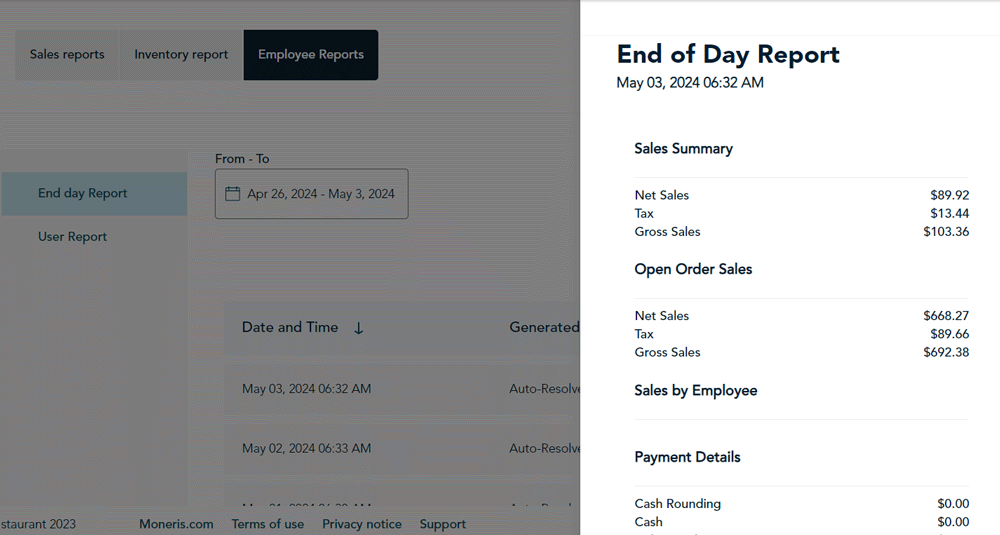
This page shows the end of day report for each day. Click on a particular day to view the end of day report for that day. The report shows: sales summary, open order sales, payment types, credit card breakdown, sales by order type, sales by category, discounts and promotions given that day, a breakdown of tips by payment type, and total cash sales. You can download the report, email it, or print it.
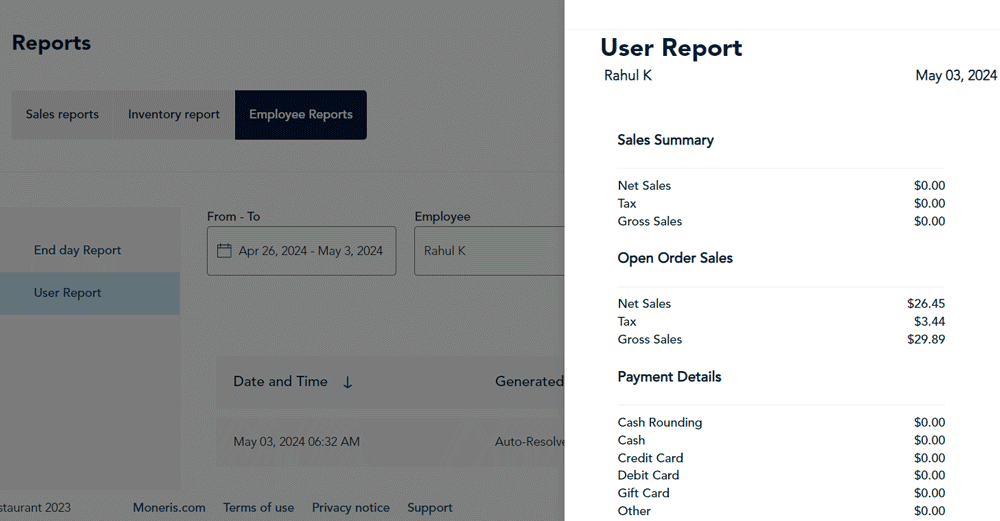
This page shows the user reports. Users include yourself and any employees for whom you have created user accounts. Click on a particular user to view their report. For each user, the report shows: sales summary, open order sales, payment types, credit card breakdown, sales by order type, sales by category, discounts and promotions given that day, a breakdown of tips by payment type, and total cash sales. You can download the report, email it, or print it.